A chart recorder is a device that reads and draws inputs onto a rolling piece of paper. The inputs are entered onto the paper with one or more pens of varying colors. For example, a chart recorder that measures seismic activity might use a red and a blue pen to measure different velocities and wave types.
In terms of operation, chart recorders come in three basic varieties: mechanical, electromechanical and electronic. Mechanical chart recorders use motorized clockwork mechanisms to roll paper under the pens. Electromechanical chart recorders use a combination of motorized and electronic elements to roll the paper and move the pens. Newer chart recorders tend to be entirely electronically operated.
Depending on the format of the chart recorder, the paper is rolled in one of three ways. In a strip chart recorder, long strips of paper are ejected from the unit. In a circular chart recorder, a spool of paper is fed in a rotating motion. In a roll chart recorder, the data is input onto a roll in a similar manner to a strip chart recorder.
Chart recorders basically serve a similar purpose to the modern-day data logger.
Origin and History of Chart Recorders
Chart recorders were first used during the 1830s to record the speed and consistency of moving vehicles and devices. Notable early uses of chart recording devices include the following:
- 1838: Charles Babbage constructs a dynamometer car with an inbuilt chart recorder, which uses a 1,000-foot-long strip of paper that unwinds onto a table. Various pens are affixed to an overhanging bridge at the center of the table. The contraption is used to record the motion of an attached railroad carriage according to numerous variables.
- 1848–1950: John Locke uses a chart recorder to make astronomical observations. This new and improved method for studying stars is soon adopted internationally.
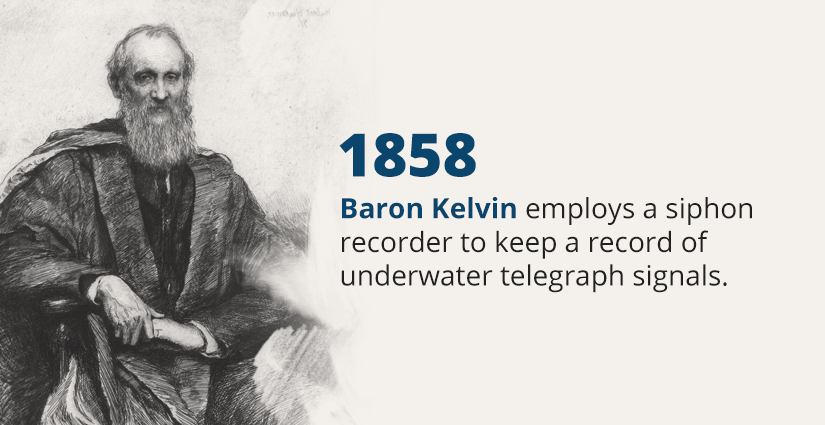
- 1858: Baron Kelvin employs a siphon recorder to keep a record of underwater telegraph signals.
- 1888: William Henry Bristol patents the Pressure Indicator and Recorder — a prototype for subsequent chart recorders. He subsequently founds the Bristol Manufacturing Company, which oversees the development of chart recorder technology during the following century.
- 1915: J.C. Stevens patents the first environmental chart recorder.
As the 20th century progressed, chart recorders became more advanced and applicable to a variety of applications.
Applications: Where Chart Recorders Are Used
Chart recorders have long been used at manufacturing plants to keep records of process factors such as pressure, flow, humidity and temperature. In laboratories, chart recorders have been used to keep graphic records of scientific data compiled through testing and diagnostics. Today, as the technology competes with data loggers, traditional chart recorders are still the preferred option for uses in remote, powerless settings and within working arsenals that lack complex computing systems.
At water purification plants, chart recorders are often used to record the flow rates of water during various points of activity. The speed or pressure at one stage of the process might generate markings of high intensity while others show less movement.
In large office buildings, chart recorders are used to record internal temperatures throughout the course of a given day. A circular chart recorder is often suitable for this purpose due to the compact nature of such units. The data can help building operators determine how to make the most efficient use of an HVAC system.
Types of Chart Recorders
The technology behind chart recorders has developed over the decades from the mechanical units of the industrial era to the digital and paperless units that are largely favored in today’s business world. Throughout these developments, certain types of chart recorders have appeared that are easy to transport and fit into confined workspaces. With improved resolution and compatibility with computing systems, chart recorders have become an essential component in various B2B applications.
- Galvanometer Instruments
On certain chart recorders, a galvanometer is used to run the markers. Under this type of setup, the markers may consist of either ink-filled pens or heated needles. In the latter case, heat-sensitive paper is fed through the machine.
The pens or heated needles run constantly against the paper feed, during which certain passages of a given recording are liable to be more intense than others. To capture the more intense moments, heavier pen pressure is applied to the paper. To ensure a smooth operation, the galvanometer must have sufficient strength to handle the pressure of more intense recordings.
- Potentiometric (Servo) Instruments
Mechanical chart recorders are less capable of sensitive pen movement if they are equipped with a galvanometer. As an alternative, the potentiometric chart recorder is equipped with a servomechanism that provides pen movement by means of energy amplification. This way, the markings can be captured with greater accuracy for slower recordings.
Thanks to the guidance of the amplifier, the pens attached to a potentiometric chart recorder are capable of error-free movement. As such, servo instruments have a vast range of recording capabilities. Still, potentiometric chart recorders are limited in terms of recording speed and have therefore mostly been confined to recording signals that change over periods of at least a second.
- Digital Chart Recorders
In more recent decades, digital chart recorders have become the norm in laboratory settings. A digital recorder works in combination with a computer system. The recordings convert from analog to digital and are printed to hard copy. Digital chart recorders are designed to handle signal variables and upsets in speed and intensity.
In a lab setting, a digital chart recorder might be connected to a large circuit board with multi-range and multi-speed modules. Digital chart recordings can be used for instant viewing and subsequent study of environmental factors as recorded from a range of input variables.
- Strip Chart Recorders
In a strip chart recorder, long strips of paper are passed under one or more marking pens. The pens are aligned over straight lines across the paper from an overhead attachment component and move as the activity is read from a corresponding source. As readings are made, the pens defect up or down from the straight lines.
Strip chart recorders are designed for continuous measurement processes. Along any given stretch of a chart recording, the paper will often be trimmed off and used to study the basic trend of the activity in question. The process is most often used for laboratory research and process applications.
- Circular Chart Recorders
A circular chart recorder captures information with a rotating component, onto which paper is rolled under marking devices. When a signal changes in speed or intensity, the pens defect up or down from their central positions. Central chart recorders are ideal for applications that are carried out over set lengths of time, such as an hour, a day or even a week.
Due to the compact nature of their design, circular chart recorders can be set up and operated within confined spaces. As such, circular chart recorders are a popular option for batch processes of specific durations.
- XY Recorders
XY recorders are used to record two opposing inputs simultaneously. A typical recording made on such a unit will chart the contrast between input X and input Y. Such recordings can be used to study how one input is affected by the other and vice versa.
XY recorders are often used in laboratories to study chemical processes. In studies where the X input records the temperature of a given environment, the Y input might record the pressure level generated in that temperature. XY recorders allow companies to observe the interrelatedness of two opposing effects in a given study.
- Hybrid Recorders
A hybrid recorder is effectively a combination of a chart recorder and a data logger. Like a chart recorder, a hybrid unit records charts based on a given input or set of inputs. Like a data logger, a hybrid unit records and stores info digitally.
Hybrid recorders are often produced with multichannel capabilities that are handled with a single printing head. For multichannel purposes, hybrid recorders are an ideal and relatively low-cost option. In modern setups, hybrid recorders add the digital component that is used for upload to computer systems and B2B communications.
- Paperless Recorders
As the name implies, a paperless unit is a chart recorder that records data without the use of a paper roll. The recordings are instead held in the unit’s digital memory and can be viewed on an attached graphic display screen. Paperless recorders are similar to data loggers in form and function.
Due to the lack of paper involved, paperless recorders are generally compact and easy to set up in narrow workspaces. The data recorded on a paperless unit can be instantly transferred to a computer system for subsequent viewing and study. Paperless recorders combine chart-recording technology with the digital capabilities that are necessary for most of today’s B2B applications.
How Do I Select a Chart Recorder?
Chart recorders are necessary for a range of applications. To determine the most suitable unit for your B2B applications, consider the following factors:
- The number of inputs that must be recorded. In order to study numerous variables simultaneously, the chart recorder will need to support multiple pens.
- The types of inputs that you plan to record.
- The type of recording that would be most useful for your studies.
- The necessary scan cycle for your applications.
- The type of interface necessary for your B2B communications.
- The unit design most applicable for your applications, be it panel-mounted or bench-style.
- The preferred type of recording for your B2B applications, log type or trend.
Beyond the basic format and setup of a chart recorder, other questions to consider include the following:
- Do you need multiple colors for different trend lines?
- Do you need an alarm function in the recorder?
- How many setpoints do you need in a given channel?
- Do your recordings necessitate message printing?
For the majority of B2B applications, you will generally need a high-tech chart recorder with digital capabilities. In a company headquarters with an IT department, a digital chart recorder would generally be the most convenient option because the records could be uploaded to the company’s computer system for easy access and study among authorized company personnel.
The choice between hard copy and paperless records is really down to company culture. If your company has made a general embrace of digital formats and has largely eliminated paper usage, a paperless digital recorder would be the most likely choice. If your company prefers to keep hard copies of all information, a strip or circular chart recorder would probably be the better option. Do take into account the amount of available office space if you consider a strip chart recorder.
Chart Recorder vs. Data Logger
Chart recorders allow users to view recorded data quickly and easily along sheets of paper. The marking components of a chart recorder are easy to replace and the charts are available in various sizes. Basically, a chart recorder is ideal for any B2B application in which physical paper is necessary for the documentation of process studies.
However, chart recorders limit studies by the length of the paper feed. The portability of a chart recorder is inverse to the data resolution, which is better in larger units. The pros and cons of a chart recorder can be summarized as follows:
Pros:
- Instantly viewable data recordings.
- Easy-to-replace charts and makers.
- Data recorded onto physical paper.
- A range of chart sizes, such as 4″, 6″ and 8″.
Cons:
- Paper and marking devices must be refilled.
- Recording time restricted to the given length of a chart roll.
- Data resolution limited in smaller units.
- Less portability with larger, high-resolution units.
Data Loggers
Data loggers have supplanted chart recorders in most of today’s B2B and laboratory applications. A data logger is a device equipped with digital sensors that read the conditions of any given environment put to study. The data is held in the unit’s digital memory and then transferred to a computer system for storage and subsequent study. As such, data loggers require a more modernized computer arsenal.
The pros and cons of a data logger can be summarized as follows:
Pros:
- Compact design can fit into almost any working environment.
- Recorded data can be viewed at any level of resolution on a computer system.
- Data can be imported into software programs and studied in different formats.
- Data available for instant viewing on display devices.
- Does not require paper charts or marking devices.
Cons:
- Data must be transferred from the logger memory to a computer via USB or Ethernet cable.
- Requires a working knowledge of computers.
Chart Recorder Repairs and Services
In the industrial sector, chart recorders allow manufacturers to capture vital info about the environmental factors of working processes. With trend recordings on paper logs or digital files, a company can determine how to most efficiently generate and assemble products and yield the highest levels of productivity. Chart recorders are also important in B2B applications that take place between companies on a local, national and international scale.
All things considered, chart recorders and data logs are complex pieces of equipment that sometimes require servicing and repair work. The next time your company needs chart recorder repairs, look no further than Global Electronic Services. Contact or call us to request a quote.