After we repair a device, one of the frequent concerns our customers have is about the reliability of the product itself. Especially once failure analysis reporting is completed and the technician has stated that the unit failed due to normal wear and tear or end of life issues. Are other units of the same type within the plant doomed to fail any second? Was the product defective? What exactly were the conditions that caused the device to enter end of life? This is where it is important to understand The Bathtub Curve and how companies use it to predict product reliability.
What is the Bathtub Curve?
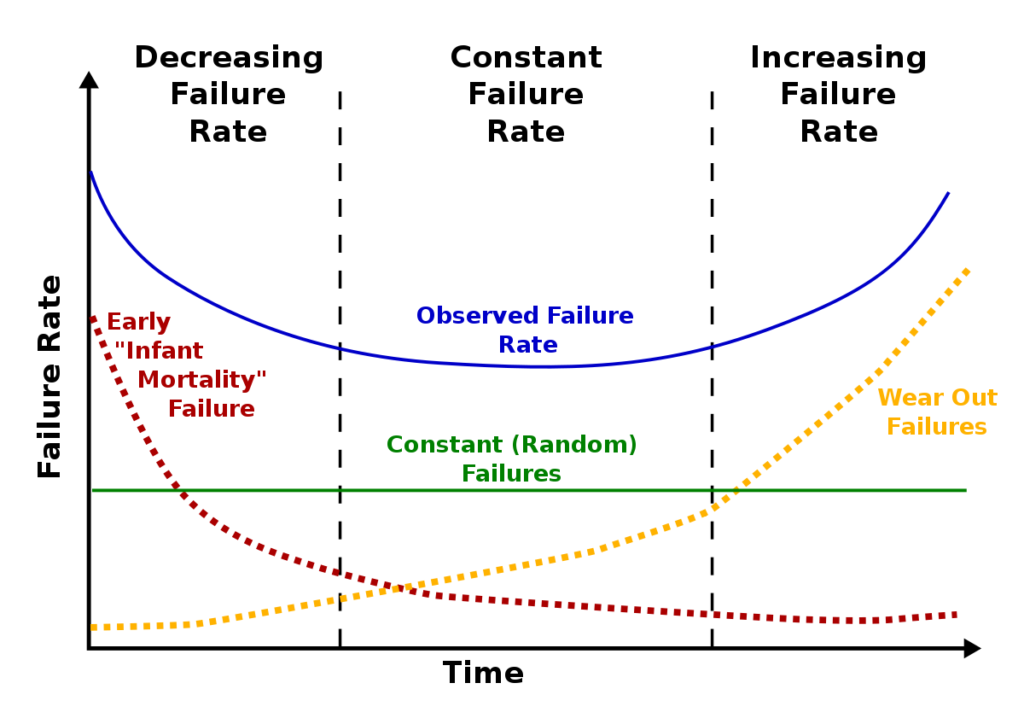
The Bathtub Curve is graph model made to represent the failure rate of a group of products over a period of time. This data helps manufacturers predict when failures happen and hopefully identify root causes and prevent them. The Bathtub Curve is represented by three parts – Infant Mortality, Normal Life and End of Life Wear-Out.
Infant Mortality
This is the part of the curve where failures happen at the very beginning to a products life cycle. This part accounts for things such as DOA or dead on arrival products, manufacturing errors, material flaws and so forth. When this data is drawn from customer reporting, a high amount of infant mortality can also be attributed to misapplication or improper installation. When it comes to repairs, we often see most product in this part of the curve being caused by customers using the product incorrectly but the chances of it being a manufacturing defect cannot be ignored. Requesting failure analysis reporting from the repair center with regards to DOA items can be important when reporting defects and placing warranty claims.
Normal Life
The second part of the curve are failures that occur within the normal functioning period or “lifespan” of the device. This is sometimes referred to as the “constant failure rate” as failures in this part of the curve are usually predictable and consistent. Failures within this time usually come when the stresses the device are subject to have exceeded the strength of its weakest component. Most of the failures we see during this part of the curve have happened because of an unexpected environmental stress or load issues. In any given application when a device exceeds its capabilities it can suffer from a normal life failure. Manufacturers and machine builders want this part of the curve to be as low as possible.
End of Life Wear-Out
The last part of the curve is the end of life for the product. This is where you will see the curve rise steeply as many of the devices components simply reach the point where they will fail due to simple age or wear and tear. Failures of this kind are somewhat predictable and in fact, often stated within the datasheets or documentation of said products – for example a tactile button will have an effective amount of presses before ultimate failure and so forth. Manufacturers will often disclose this lifespan model as a part of their product documentation. This is where repairs can help the most, as repairing an item and replacing the weakest components with new, will effectively “reset” the devices curve. This can dramatically increase the lifecycle of the product.
Do you want to increase the lifespan and reliability of your electronic equipment? Be sure to visit us online at www.gesrepair.com or call us at 1-877-249-1701 to learn more about our services. We’re proud to offer Surplus, Complete Repair and Maintenance on all types of Industrial Electronics, Servo Motors, AC and DC Motors, Hydraulics and Pneumatics. Please subscribe to our YouTube page and Like Us on Facebook! Thank you!